NimbleApp common-platform documentation
This document describes the features used by mobile teams for both platforms (iOS and Android). Once you've reviewed this, you can review OS specific docs:
Contents
- Basics
- Using the Site
- Continuous Integration
- Further documentation
Basics
Scenarios
Scenarios, or User Flows, are profiles of actions a real user might take. These can be things like loading a new page, clicking a control and waiting for the response, or scrolling a page. Cold Startup is one type of Scenario which NimbleApp always measures. There are two ways to profile other Scenarios.
Cold Startup
Cold Startup is the first Scenario we profile, and the only one we profile for every app since it is a universal concept. Running your app directly after a device restart is a good example of real-world Cold Startup. We measure Cold Startup under the following conditions:
- App has already been installed and run on a device
- App is not currently loaded in the background
- The time from app icon is clicked on Home until we determine Startup has finished.
How does NimbleApp know that an app finishes startup?
We use a heuristic to tell when an app finishes startup by detecting when
- the main Activity has been displayed
- things like animated progress bars in the main Activity have stopped.
Before measurement starts, we run the app at least twice, wait for up to 30 seconds, and check the last Activity displayed. If this is consistent across multiple startups, it is designated the main Activity.
If this methodology doesn't match what you are trying to measure, you can customize the way Cold Startup is measured; see the Customization section.
Auto-discovered Scenarios
In order to provide maximum value with minimum effort, NimbleApp will try by default to auto-discover Scenarios in your app using a crawler. The crawler will do simple actions like clicking buttons to discover navigation and actions in your app and build Scenarios from them. The crawler will run for a set amount of time and will add any Scenarios it finds.
Auto-discovered Scenarios always report measurements for the last action a user would take. There can be a variety of "setup" actions the user takes that would not get measured, followed by a final action that is measured. For example, a user might load the Home screen, click on a Product, Add To Cart, then click View Cart. In this case the loading of the Cart page is the last user action, and the one that would be measured.
Auto-login
Since many apps have important Scenarios accessible only after logging in, NimbleApp provides an auto-login feature which will accept credentials from the user and attempt to use them to get the app into a logged-in state. For more on setting up auto-login, see the Using the Site section, and the Advanced Usage section for info about auto-login with the API and other integrations.
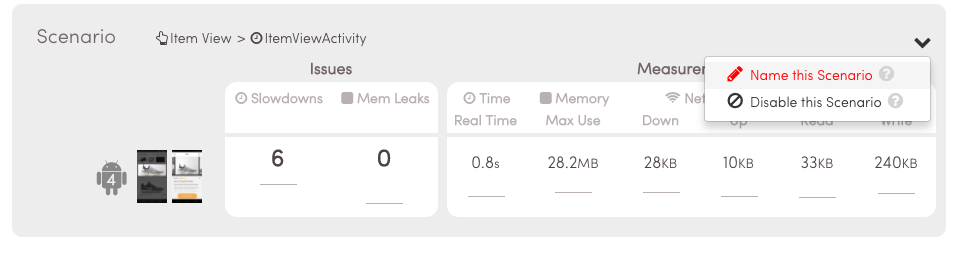
Crawled Scenario names
By default crawled Scenarios are named after the steps that are taken to produce them. You can rename these if you'd like to use a shorter or more meaningful name. This can be done on the App Info page, on the right-side dropdown for the relevant Scenario.
Steps to make the auto-crawler more effective
There are steps you can take to assist NimbleApp's crawler in discovering Scenarios:
- Add unique IDs and class names to clickable widgets.
- Provide credentials if your app requires login. Check Scenario screenshots to confirm login has succeeded.
- The crawler crawls widgets that are clickable or whose parents are clickable, make sure your important flows have a clear clicking structure
Limitations of the crawler:
- The crawler does not do scroll and swipes at the moment.
- The crawler does not support SMS or two-factor auth.
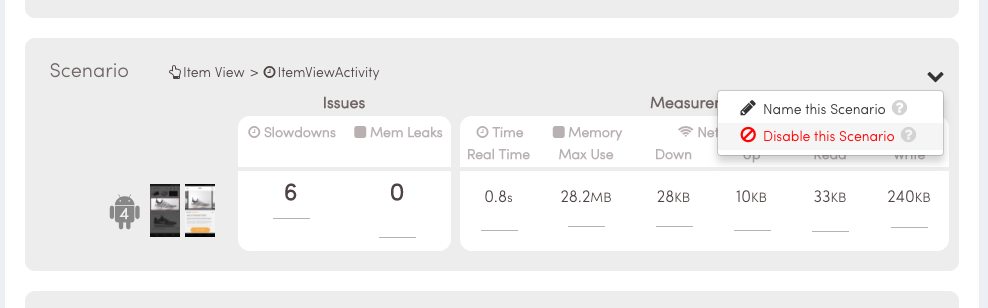
Disabling irrelevant Scenarios
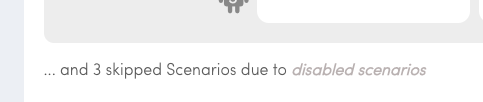
The crawler may also identify Scenarios that you don't care to have measured, for example loading a Terms of Service page. You can disable Scenarios to prevent them from being profiled and from being shown in the interface. This will also reduce the overall time it takes to profile your app.
To disable a crawled Scenario, look for it on the App Info. The dropdown menu on the right side will allow you to disable it in future uploads. Disabling can always be undone via the App Setup page.
User-defined Scenarios
Usually customers have specific critical user flows that they want to profile that may not be covered by the auto-crawler. NimbleApp supports custom user flows via UI testing framework. You can find more details in the Customization chapter for your OS.
NimbleApp can also create and maintain custom Scenarios for you. When you begin your trial, let us know you are interested in this service.
Measurements and Profiling
NimbleApp measures a number of important metrics for your app, as well as analyzing and diagnosing aspects of the underlying code.
Quantitative data
-
Speed
Speed is defined as the clock time from when the user takes an action, like clicking or scrolling, until the app finishes responding to that action. For actions like Cold Startup, a speed of 2 seconds or less is recommended. The
-
Frame Drop Rate
This is the percent of time the app spends dropping 2 or more frames during the Scenario run time. So for example an FDR rate of 20% for a 3 second Scenario would mean a sum total of 0.6s that the app is dropping frames.
For Android you can find out more about this metric here and here.
-
Network bandwidth (up and down)
The amount of network traffic observed
-
Max memory usage
The maximum memory the app used at any point during the Scenario.
-
Disk bandwidth (read and write)
The amount of data written and read to disk during the Scenario.
-
Method count
Total method count for the app. This number is particularly critical in Android because of the 64K method threshold. We will also report method count breakdown by "library" (e.g. Crashlytics, OkHttp).
-
Download size
Size of the app file as if downloaded by a user from the Play store.
Other reported data
-
App crashes
If an app crashed during a Scenario, NimbleApp will report the crash along with the stack trace to assist with diagnosis.
-
Thread Timeline
See the full explanation of the thread timeline
-
Call stack
This is a list of methods that are called during a Scenario, and the amount of time spent for each. The calling hierarchy of methods is also shown.
-
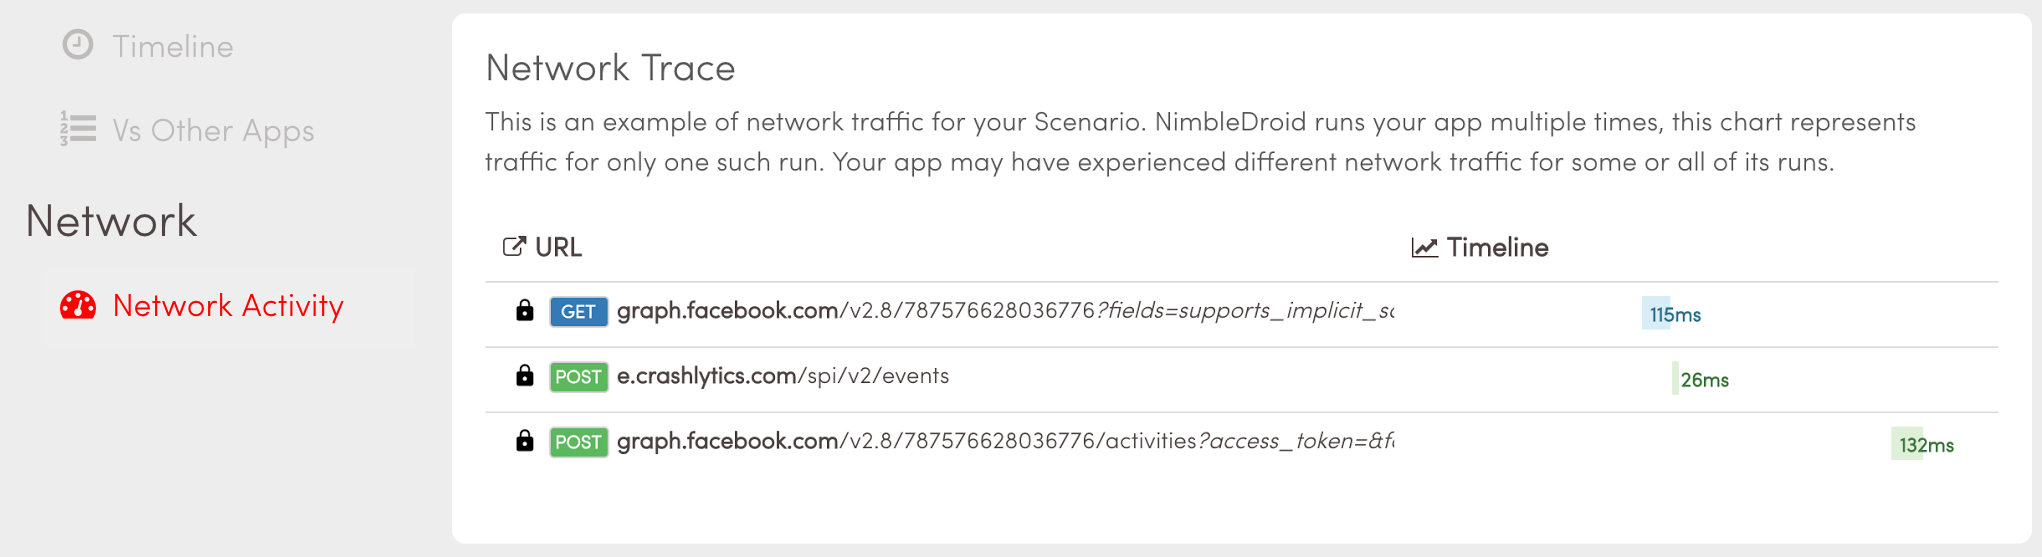
Network trace
Performance and functional problems can often be attributed to network-related code. You can review network traffic requests, including the request URL and the timeline of the request. You can find this information for each Scenario in the left hand menu under Network Activity.
Using the Site
Uploading
Uploading using the site is done in one of two paths. The first is a wizard for uploading an app the first time. Once an app has been setup and run once, the user then sees a single page upload screen, which will allow them to quickly upload, or customize settings if needed.
Adding credentials for Auto-Login
If supplied with app credentials, NimbleApp will attempt to use them to login before measuring Cold Startup and other Scenarios. NimbleApp runs the app for auto-login before other measurements take place, and will quit the app once login is successful in order to not interfere. Apps that remain logged in after exiting will work with auto-login.
You will be prompted for credentials at upload time. You can also change or add persistent credentials on the App Setup/App Data page.
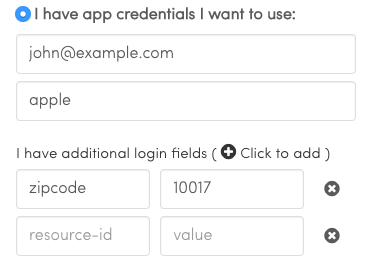
The interface provides fields for the two most common login fields, username and password. NimbleApp will attempt a variety of algorithms to identify the relevant controls in the app.
Some apps require other fields for login, so it is possible to add arbitrary login fields and values, in the form of resource-id and value.
Ensuring your backend supports multiple logged-in devices
Sometimes apps have backend server restrictions that prevent a set of credentials from being used in more than one device at the same time. In this case auto-login will not work since NimbleApp runs an app in parallel on multiple devices to provide quick results. You can update the restriction on your backend, or NimbleApp provides a setting to force profiling to take place serially to ensure no simultaneous credential usage. This can be enabled on the App Setup/App Data page. Using this feature will greatly raise the latency for receiving results.
Choosing profiling environment options
You can choose to run your app profiles in one or more environments (e.g. OS version). Choosing two environments will generate two different profiles for each Scenario.
Choosing files to upload
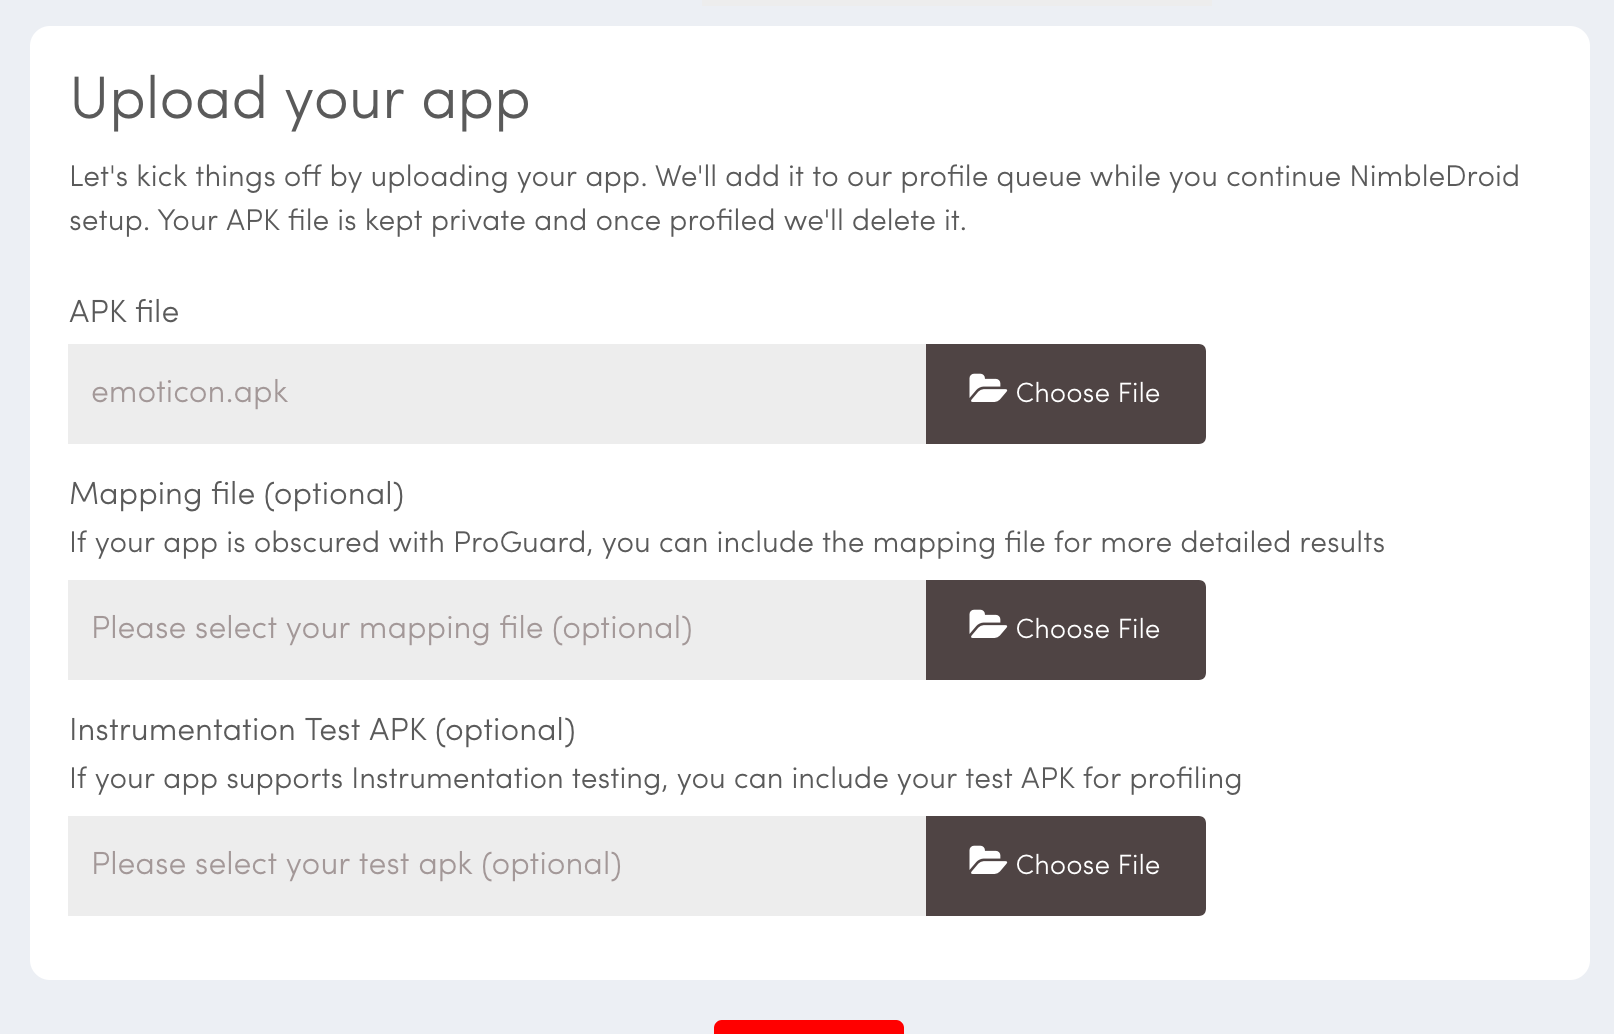
App file
This is your app file, signed and ready to run.
Mapping file (optional)
For apps obfuscated with ProGuard, you will want to also upload the mapping file in order to get meaningful issue diagnosis. Otherwise a ProGuarded app will show methods like a.b in the diagnosis sections, making it difficult or impossible to match with real method names.
Instrumentation Test file (optional)
This field is for the UI test file, for the purpose of running profiles on user-created custom Scenarios. See your OS documentation on custom Scenarios for more details.
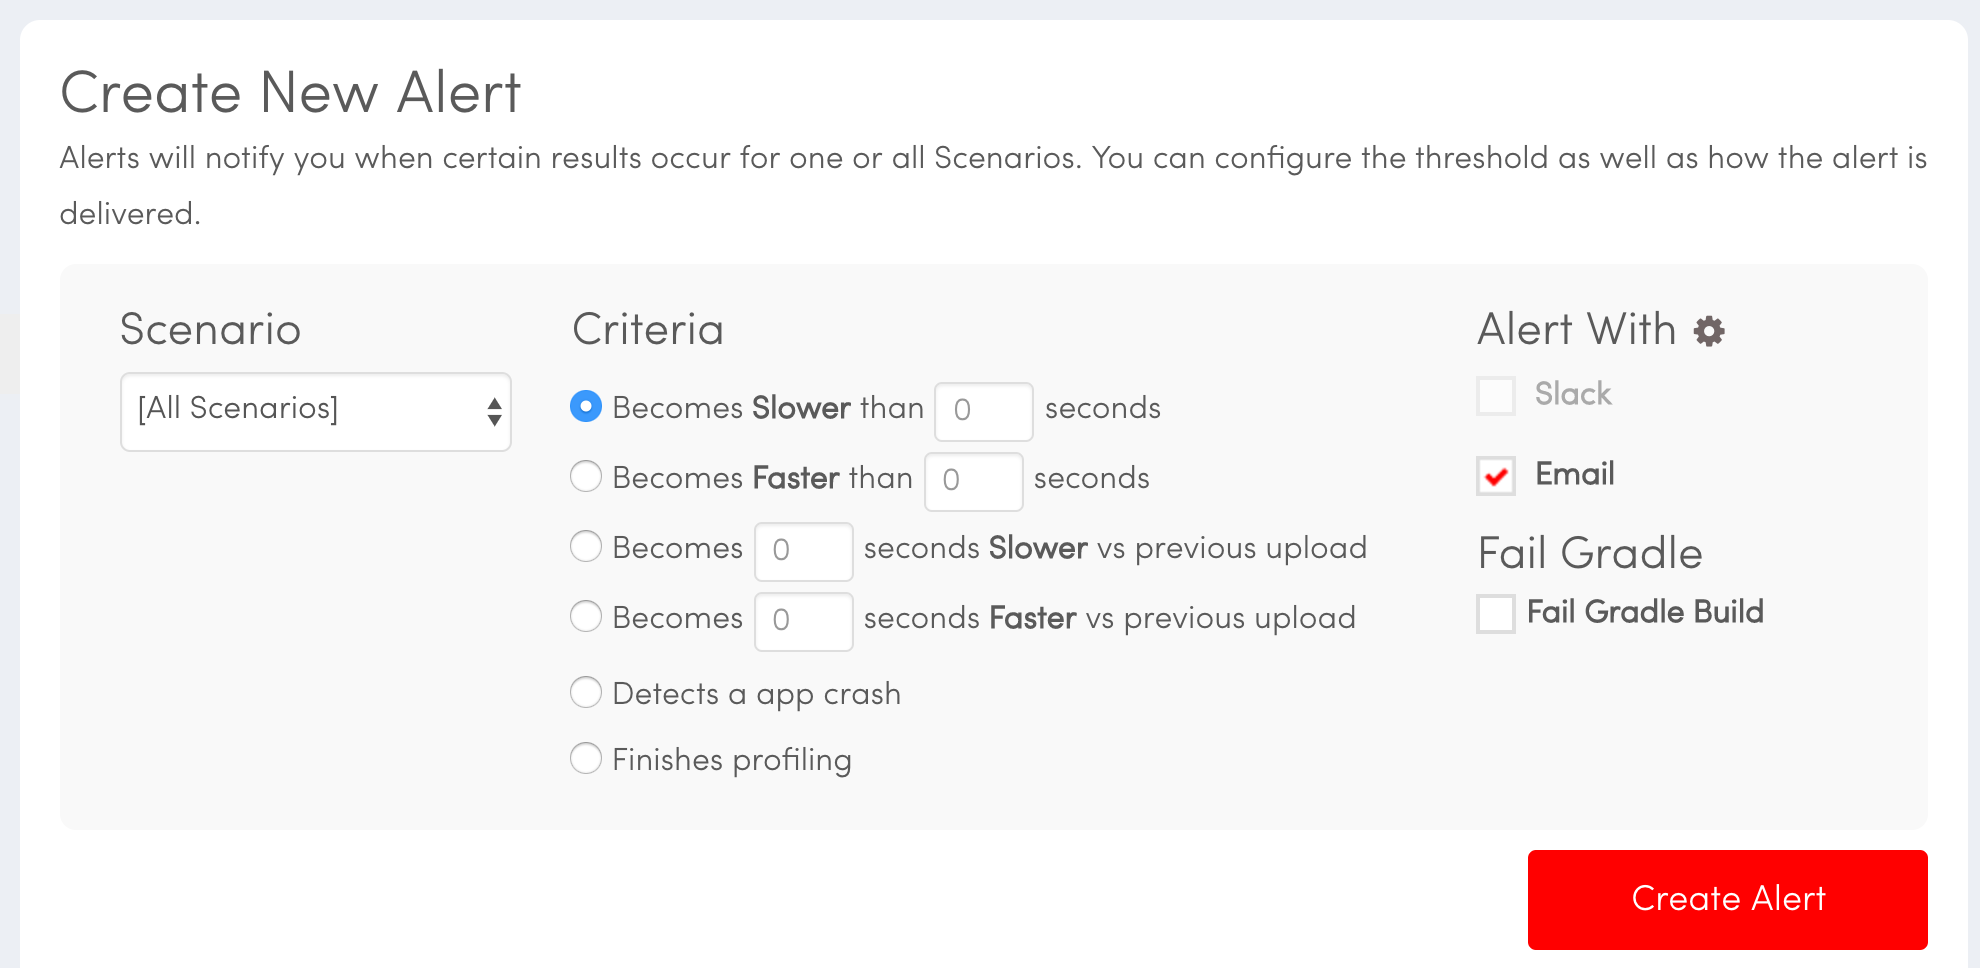
Set up alerts
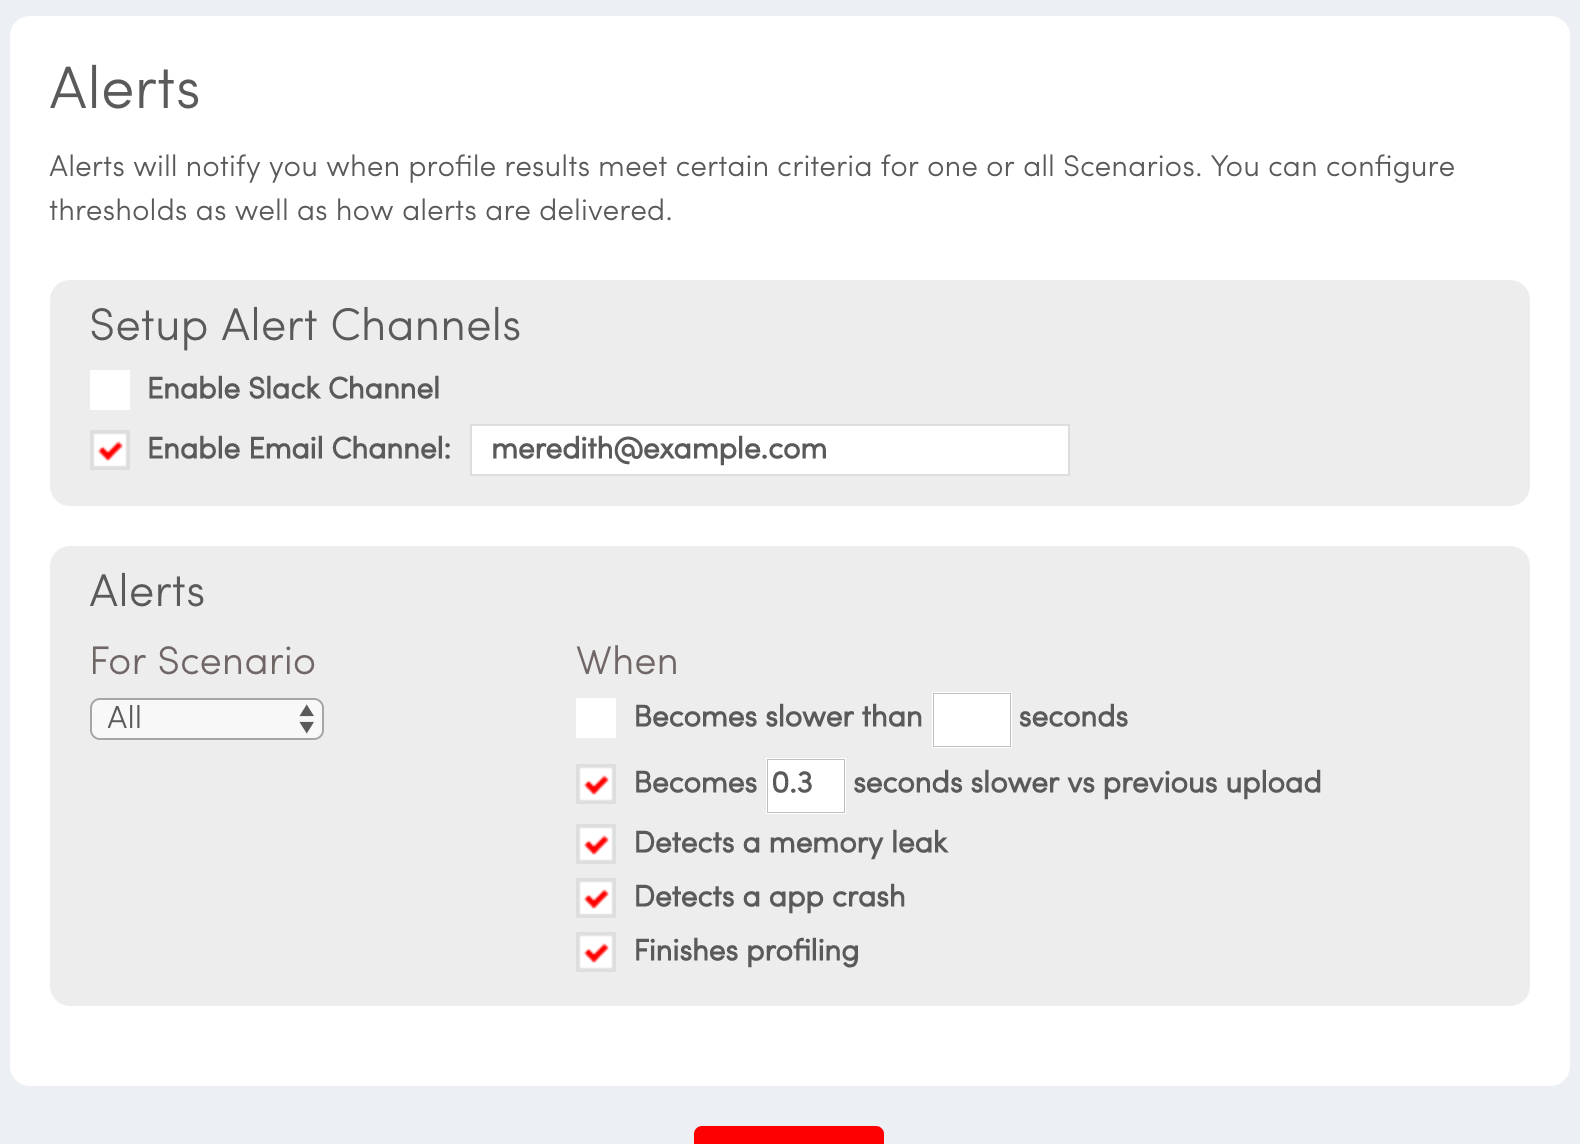
One of the key advantages to using NimbleApp is the ability to receive a notification when something significant happens with a new build of your app. This can be a performance regression or other significant changes.
You will first choose one or more channels for alerts (email or Slack), and then choose which conditions you wish to receive alerts for.
Sharing
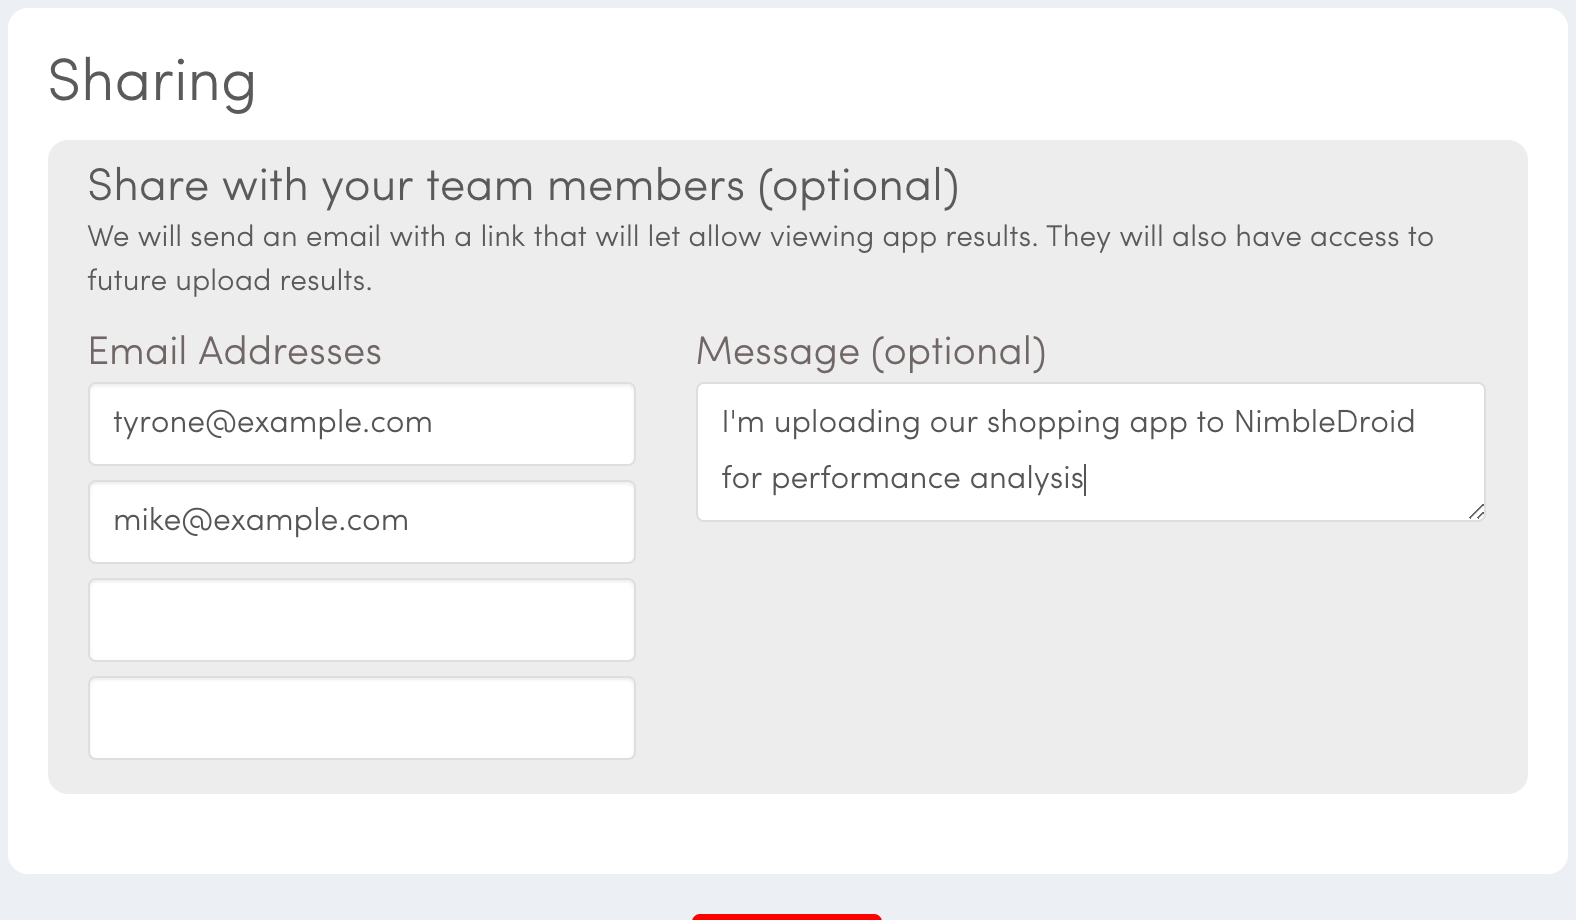
In addition to viewing results yourself, you may want to share results with other individuals. The sharing dialog will allow you to email others with a link that will give them access to all your uploads of the current app.
For Enterprise teams, contact us to find out about enhanced team management features.
Setting up Continuous Integration uploads
The most powerful way to use NimbleApp is to add uploading to your CI build process. In this way NimbleApp can look out for regressions and alert you immediately when they occur.
There are instructions on the last step for integrating with CI. Also see the section below, Continuous Integration
Reviewing results
App Overview Navigation
When you upload, you will be able to review your results at a high level and in detail. The navigation is broken into three primary sections:

- App Info
- Scenario Details
- App Setup
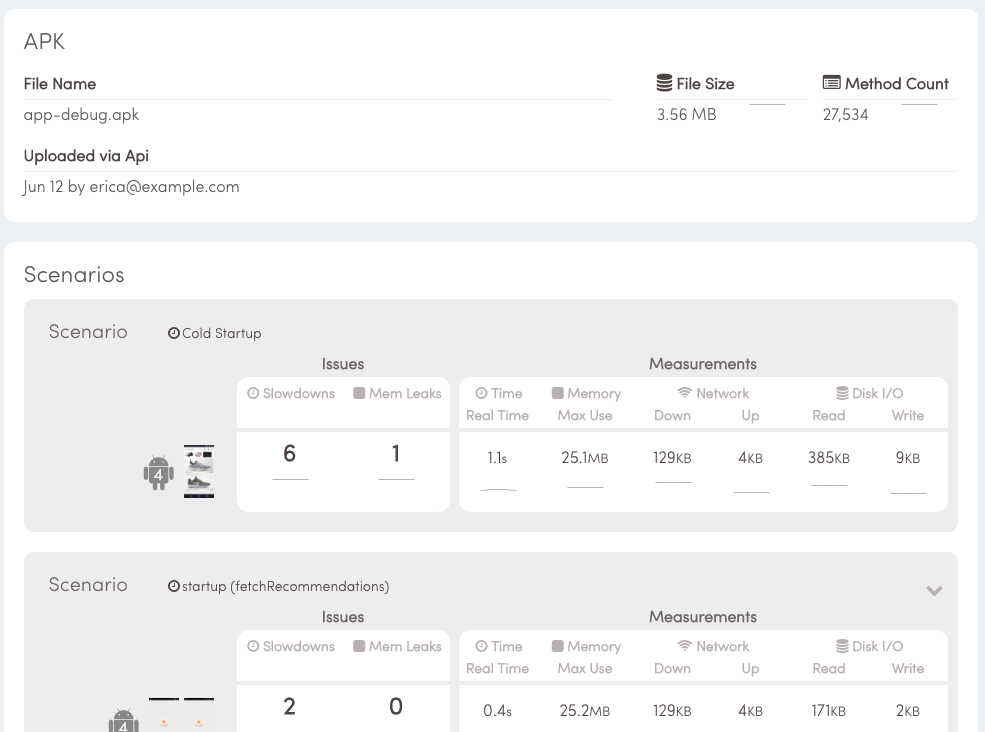
The App Info page
The App Info page is the overview of an upload. It has metadata like time of upload, uploader, file name. It also lists Cold Startup, crawled Scenarios, and custom-defined Scenarios. The list is updated as new Scenarios are discovered and profiled.
For each Scenario, measurements are listed, along with a small spark line to indicate provide an idea of trending. You can get more details on a Scenario by clicking its name, screenshots, or data.
Scenario Details page
Navigation
 Top nav for a Scenario lets you toggle between different uploads you've made, as well as between different run environments (e.g. Android 5) as well as change the current Scenario being viewed.
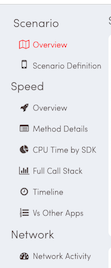
Side navigation will let you view the different aspects of the Scenario profile.
Overview
This will show you screenshots from the Scenario steps, top level stats about the Scenarios, as well as a list of slow methods.
Scenario Definition
This will show in detail each step that was taken in the app during the course of app state setup (getting to the final action) and the last screenshot of the profiled final action.
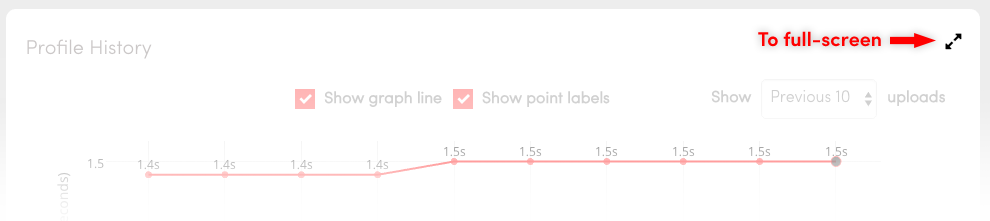
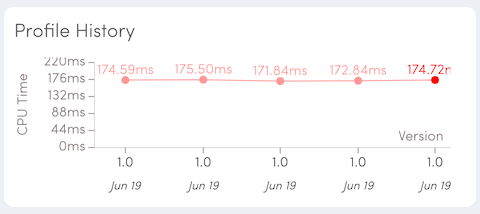
Speed Overview
Lists the slow methods detected, and shows a trending graph for the Scenario speed measured for different uploads. You can choose different number of points to display on the graph. Hovering on a graph point will reveal details about upload time, measurement value, upload information, and git hash if available. You can view trending graphs full screen by clicking the full screen control.
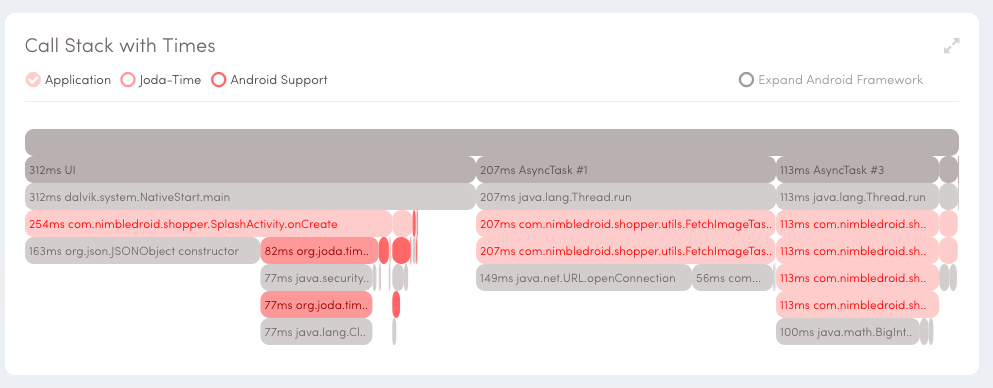
Method Details
This is similar to the Full Call Stack (see below), but restricted to a particular method that has been identified as a performance issue. You can tell what constituent code in the method may be adding to the issue.
CPU Time by SDK

This graph groups CPU time spent in methods that belong to different SDKS and libraries. You can use this to identify if certain third-party SDKs are disproportionally responsible for performance issues in your app.
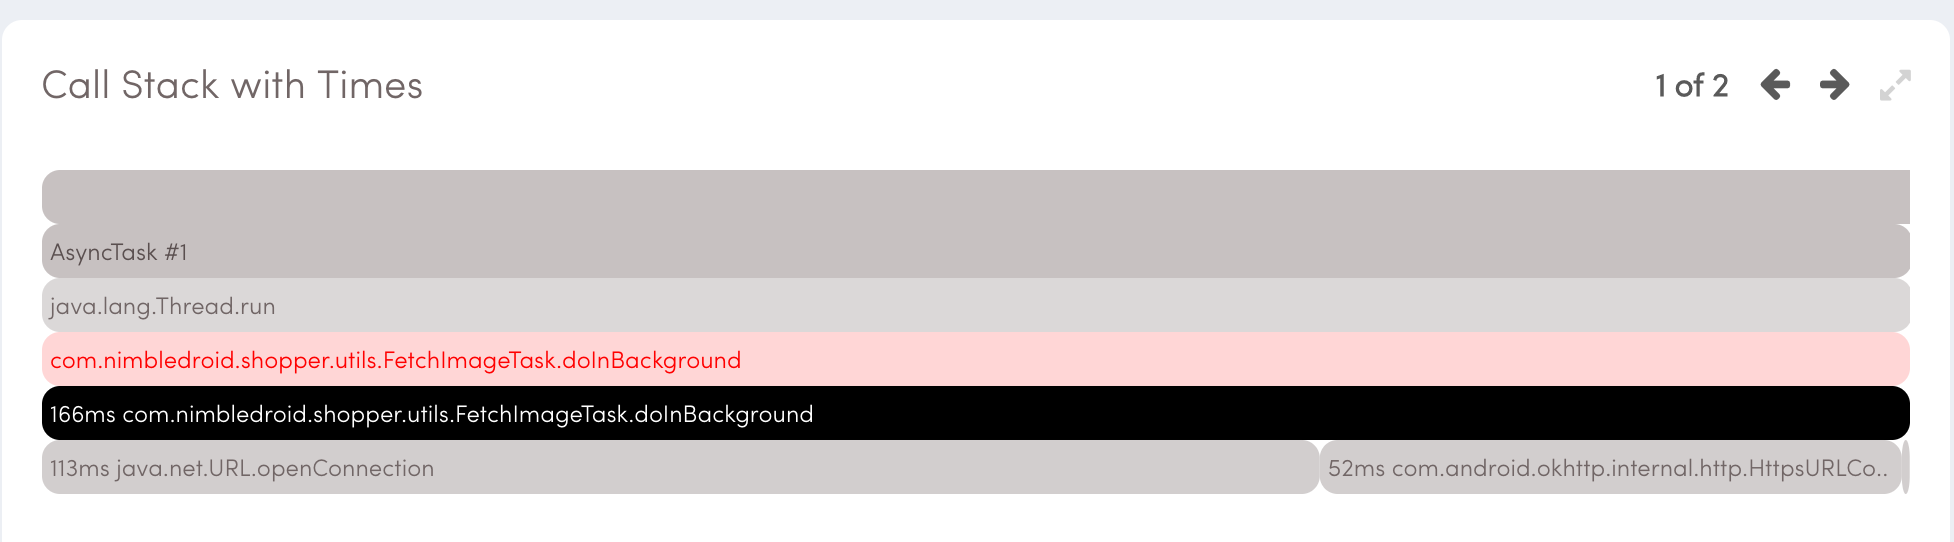
Full Call Stack
The call stack gives visibility into which methods in your app are taking time to execute. The design lists calling methods higher than called methods in the stack. By navigating down the stack you can see subsequent calls, and navigating up you can see callers. There are some important notes about this display:
- The call stack diagram does not represent a timeline, there is no chronology. Methods on the left do not get executed before methods on the right.
- The ms figure you seeing next to a method may be for a single invocation of a method, but can also be a sum of all instances of invocations for that method. For example 100ms can mean 1 call that took 100ms, or 100 calls that took 1ms each. If you hover your mouse on a method you can get the exact invocation count.
Timeline
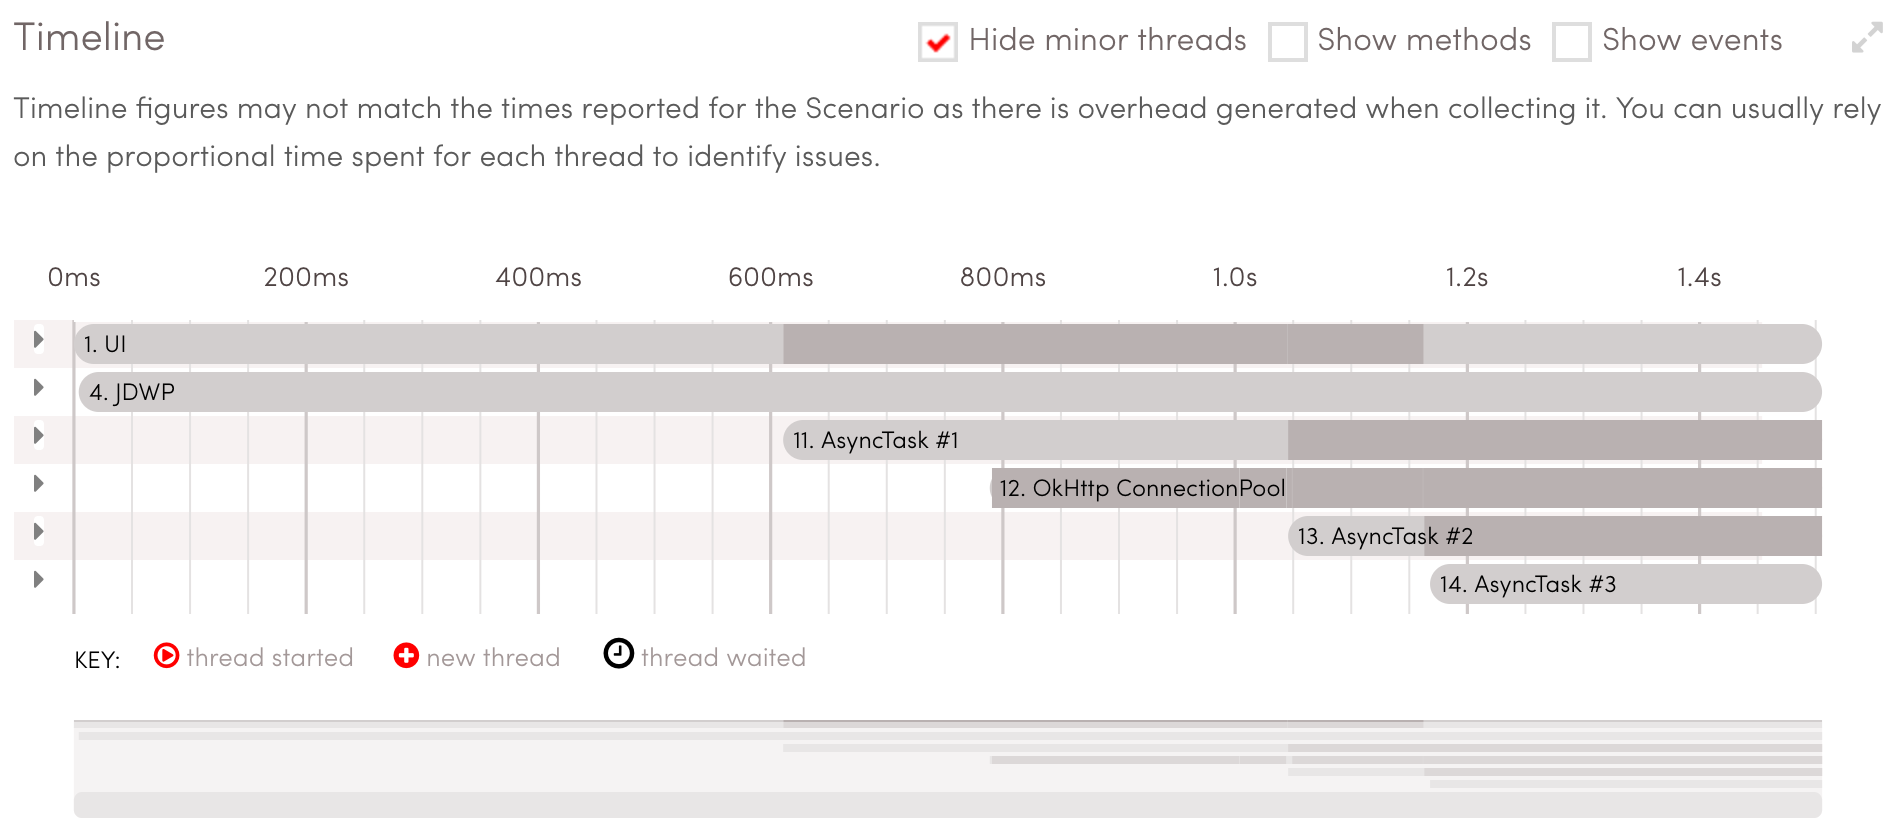
The Timeline displays real time method trace over time per each thread. Unlike the Full Call Stack, which shows aggregated CPU time of methods, the Timeline shows when an individual method begins and ends in real time. the Timeline also displays thread information such as thread id, thread name, thread start time. and thread events.
A light gray line, the thread bar, in the Timeline indicates a running thread. A running thread can be paused and resumed by thread events such as wait and sleep, and this "paused" status is displayed as a dark gray section inside a running thread.
Each thread in the Timeline can be expanded by clicking the arrow button on the left side to display the call stack in real time.
Other options:
- The timeline by default doesn't display minor threads which don't spend much time, and you can see minor threads by unchecking "Hide minor threads".
- "Show methods" option enables displaying the method occupying the thread at each moment on the thread bar.
- "Show events" displays more detailed information about thread events; when a thread creates another thread and when a tread wakes up another thread.
Vs Other Apps
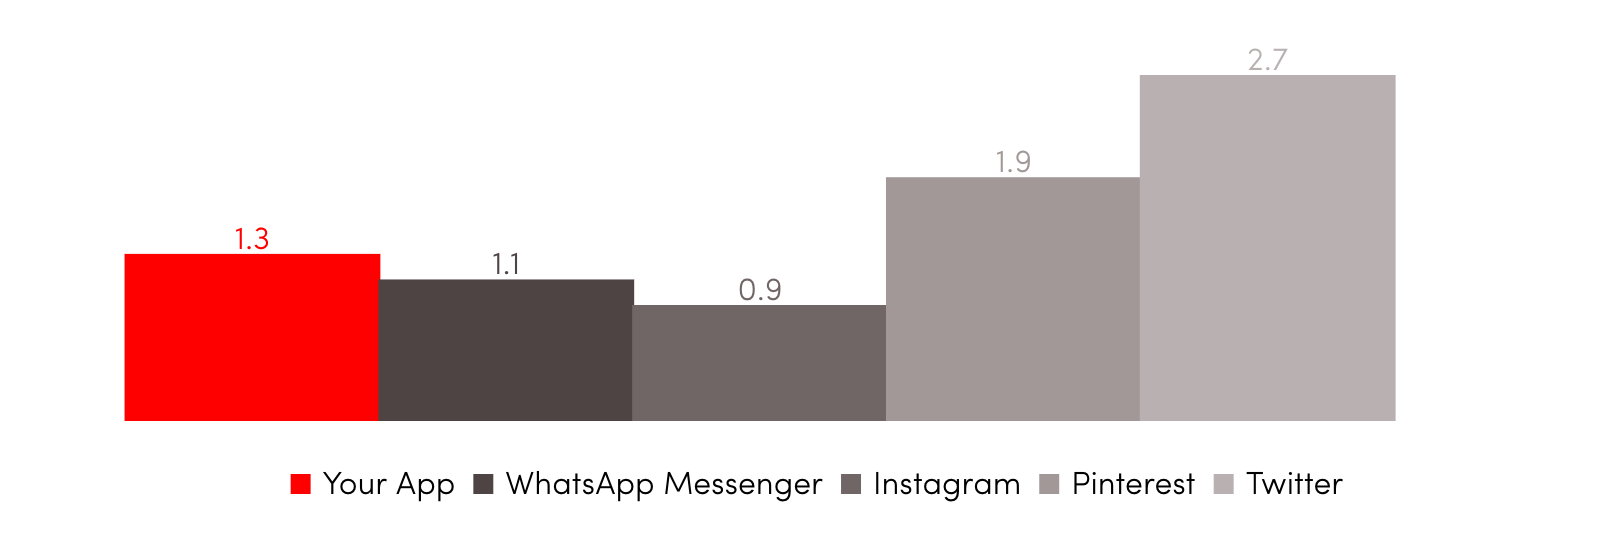
This allows you to monitor how your Cold Startup time compares to other popular apps. To customize which apps are shown, go to https://nimble.app/play , search for an app, and follow it to see it in the comparison.
Method Count
In addition to total method count, NimbleApp will also break down the method count into individual libraries, so you can better understand which libraries and SDKs are contributing to your overall method count.

Managing Uploads
You can see a list of all Uploads for an up on the App Info/Uploads page. Uploads are listed reverse chronologically.
Archiving Uploads
If you have uploaded a version of the app that you have decided should not be included in trending and other results, you can archive that upload. This is done from the Uploads page, in the dropdown next to each version. Archiving an upload will make it seem to the rest of the site UI as if the version was never uploaded. Archiving can also be undone from the Uploads page.
Team Dashboard
The team dashboard page lets your whole team monitor the overall state of your app across recent uploads.
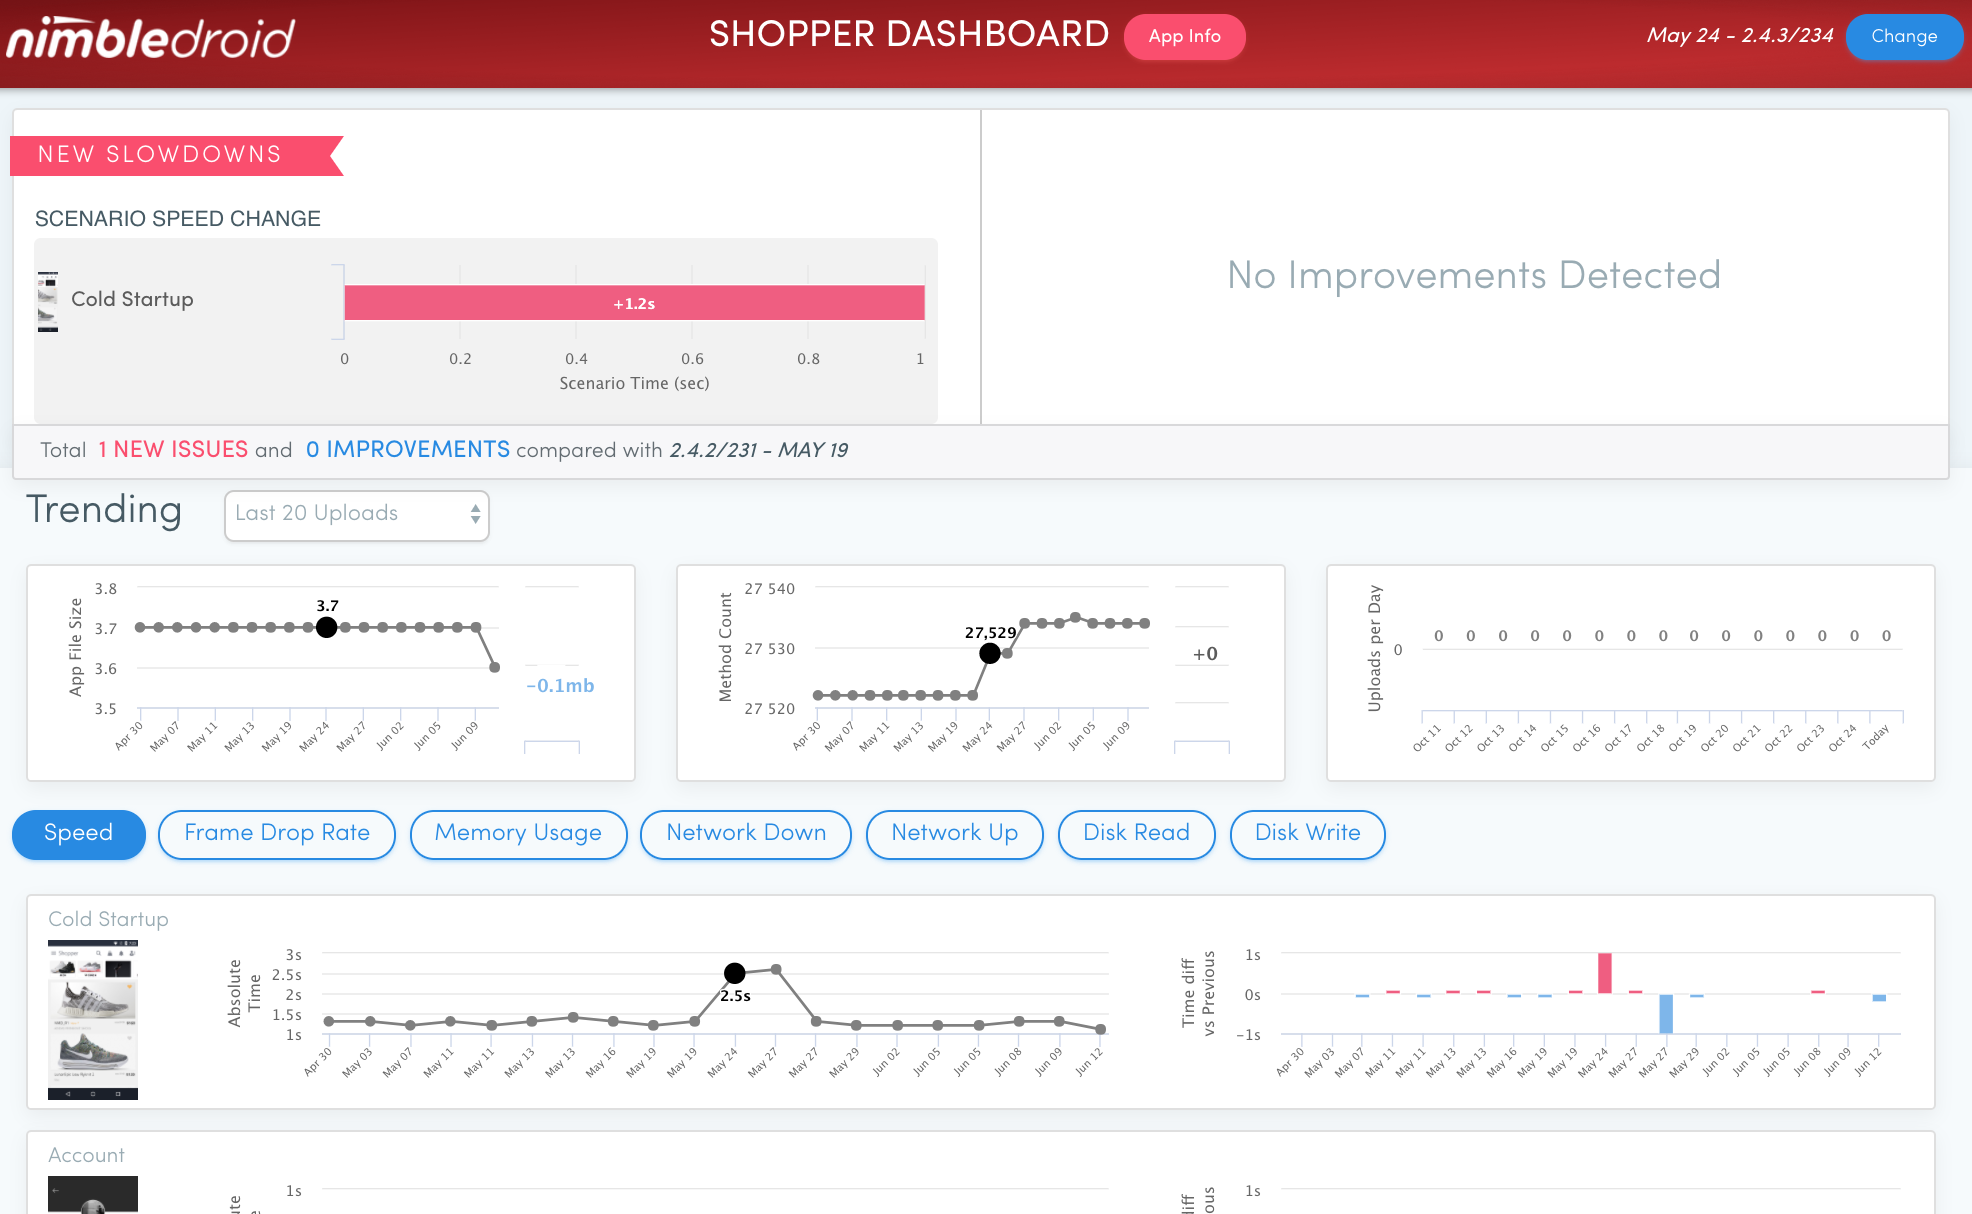
Changes vs previous upload
This section will tell you if there have been notable changes vs the previous upload, specifically new issues or fixed issues.
Continuous Integration
To get the full power of NimbleApp, we recommend automatically uploading as part of your build process.
- Generate performance history for your development process
- Save time manually uploading builds
- Catch issues earlier in the release process
Getting an API key
You can get an API key on your account page at https://nimble.app/account . The API key can also be reset on this page. After resetting, the old API key will no longer work.
Using the Gradle plugin
NimbleApp provides a Gradle plugin to make it easy to integrate our service with CI builds. The full documentation for the Gradle plugin is located here https://nimble.app/help/ci .
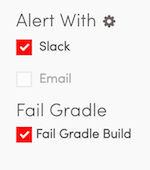
Failing a build with the Gradle plugin
In addition to getting notified of issues by Alerts, you can fail a CI build that is using the Gradle plug-in under specific conditions like a Scenario getting slower, or an app crash. Failing can be enabled in the App Setup section under Alerts.
Uploading with the REST API
See the Advanced Usage section for information on uploading directly to the REST API.
Alerts
If you have NimbleApp integrated with your Continuous Integration server, we support email and Slack alerts that can inform you about slowdowns, or app crashes. You can configure Alerts for your app in the App Setup/Channels and App Setup/Alerts tabs.

An example Slack alert
Further documentation
That concludes the common-platform documentation. Below are the links for platform-specific documentation.